Retail Trends Factfile 2017: Mobile
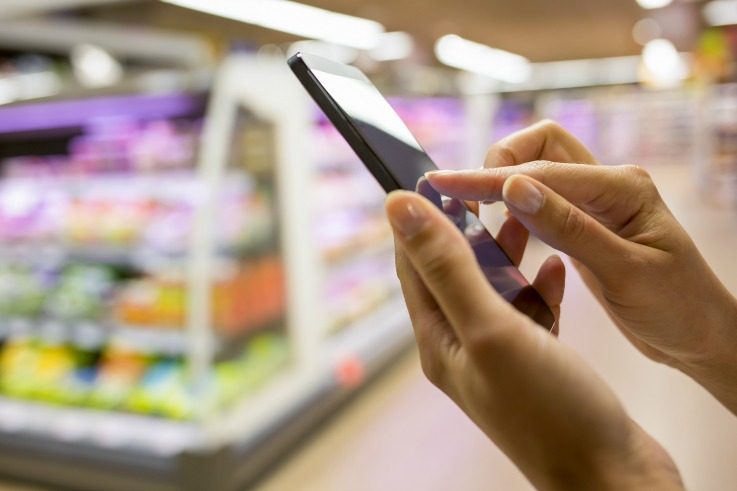
UK retailers saw an increase in online sales through smartphones and tablets up to 31% as more consumers are choosing to purchase via these channels. (KPMG, 2016)
US retail sales through digital channels (including mobile sales) increased by a massive 23% in 2015. (Harvard Business Review, 2017)
Visits to retail websites in the UK via mobile devices accounted for two-thirds (66%) of traffic in Q4, up from 63% in the previous quarter. This compares with 53% in Q4 last year. (IMRG, 2016)
The percentage split of total UK online sales between the types of channel for Q4 2015/16 was as follows: Desktop / laptop – 49%, Tablets – 33%, Smartphones – 18% (IMRG, 2016)
A major digital tipping point has been reached – with the percentage of UK online retail sales made through mobile devices (smartphones and tablets) exceeding 50% for the first time in Q4 2015/16. (IMRG, 2016)
Consumers find mobile apps more useful than stores for finding information about products and promotions. (Capgemeni, 2017)
More than 80% of the US population has a mobile phone, according to eMarketer data. (AppBoy, 2017)
Among those 18 and older in the US, 95.1% have mobile phones. (AppBoy, 2017)
According to the GfKMRI data, more people go online in the US via mobile phone than via desktop/laptop. (AppBoy, 2017)
Mobile internet usage in the US declined with increasing age. (AppBoy, 2017)
Mobile shoppers will be virtually synonymous with digital shoppers in the US by 2020. (AppBoy, 2017)
Retail mcommerce sales in the US will nearly triple in four years due to sales via smartphones. (AppBoy, 2017)
By Q2 2016, 70% of all mcommerce on the Criteo platform was being done via smartphones in the US. (AppBoy, 2017)
Within retail, video games, consoles and accessories lead as mobile purchases in the US. (AppBoy, 2017)
37% of US retail sales in 2016 were influenced by mobile, which translated to $1.4 trillion in sales. (AppBoy, 2017)
The majority of online shopping traffic in the US is mobile, with most coming from smartphones. (AppBoy, 2017)
Factors that affect a smartphone’s conversion rate include device type, screen size, operating system and load time. (AppBoy, 2017)
The majority of retail mcommerce orders come via iOS users in the US. (AppBoy, 2017)
In the US, app conversion rates are three times higher than mobile web conversion rates. (AppBoy, 2017)

Half of US internet users on mobile visit Amazon to research products. (AppBoy, 2017)
69% of mobile shoppers prefer promotions to suggestions in the US. (AppBoy, 2017)
Sending too many messages via push is the number one reason people disable apps in the US. (AppBoy, 2017)
49% of people surveyed in Europe think that by 2030 there will be in-store navigation (used on your mobile to find the way to the desired product). (Comarch/Kantar TNS, 2016)
28% of people surveyed in Europe think that real-time personalised offers will appear when you are nearby a store by 2030. (Comarch/Kantar TNS, 2016)
£288 million was spent through mobile contactless transactions in the UK in 2016. (World Pay, 2016)
In the UK, there was a 247% increase in mobile transactions as percentage of all in store transactions in 2016. (World Pay, 2016)
Almost half of US consumers are researching online before they buy: 54.6% use a PC or laptop, 40.4% use smartphones, and about 21.4% use tablets. (I Vend Retail, 2017)
In the US, 33.5% say the in-store experience could be improved with offers sent directly to their phones when they enter the store. (I Vend Retail, 2017)
By 2019, 20% of brands will abandon their mobile apps. (Gartner, 2016)
The mcommerce sector in the UK is likely to almost double over the next few years. (World Pay, 2016)
iPhone Sales May Have Peaked in 2015. (KPCB, 2016)
Mobile maintained its upward momentum in 2016, as phones captured 52% of all traffic and 30% of orders. (Demand Ware, 2016)
Social was a more important traffic channel in retail in 2016, accounting for 4% of all traffic and 5% of mobile traffic. (Demand Ware, 2016)
Visit duration, which fell consistently in recent quarters, increased to 6.6 minutes in 2016, the longest duration since 2014, aided by an increase in mobile visit duration.(Demand Ware, 2016)
Survey respondents around the globe chose screen size as the greatest obstacle (40%) to shopping with the mobile, with 26% saying that another obstacle was that mobile sites are simply not easy to use. (PwC, 2017)
39% of respondents say that social networks provide their main inspiration for purchases. (PwC, 2017)
With their smartphone, 37% globally say they had paid for purchases, just behind “researched products” at 44% and “compared prices with competitors” at 38%. (PwC, 2017)
In May 2016, the U.S. top 15 app publishers saw a 20% year-over-year decrease in app downloads. (PwC, 2017)
A vast majority of retailers said that their two main channels for generating sales were “Stores” at 79% and “Website” at 73%. Only 25% chose “Mobile Apps,” which barely beat “Catalogue,” at 24%. (PwC, 2017)
Social media interactions with favourite brands led 44% of a global sample to spend more with a brand, and encouraged 46% to endorse a brand more than they usually would. (PwC, 2017)
59% of people think real-time offers are important. (PwC, 2017)
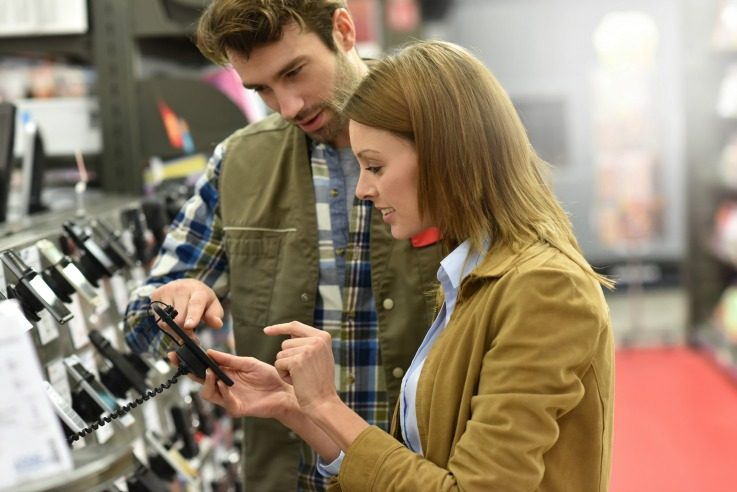
65% of shoppers are wary of having their personal information hacked using their mobile/smartphone. (PwC, 2017)
35% of shoppers say the mobile/smartphone will become their main purchasing tool. (PwC, 2017)
Only 11% of US users access the Internet via desktop only – almost all users are using multiple devices. (com Score, 2016)
Mobile sessions accounted for 59% of all sessions by device on eCommerce sites, but these mobile browsers made up just 38% of revenue. (Wolfgang Digital, 2016)
Conversion rates on smartphone (1.5% average) are one third of those of desktop (4.4%). (Monetate, 2016)
The most in-demand new technology for retailers in the UK and US is mobile payment capabilities (65%), followed by self-checkout (49%), scan as you shop (44%), click and collect (41%) and in-store customer analytics (37%). (Zynstra, 2016)
78% of surveyed US brands don’t offer shoppable mobile apps. (New Store, 2016)
64% of brands surveyed in the US use in-app push notifications for promotions and other content. (New Store, 2016)
4% of US brands surveyed promote their apps in-store. (New Store, 2016)
24% of US brands surveyed display real-time inventory on their apps. (New Store, 2016)
18% of store associates are empowered with real-time inventory information on a mobile device. (New Store, 2016)
2% of brands surveyed in the US allow for customers to share their purchases on social media. (New Store, 2016)
88% of brands offer access to a loyalty account through an app. (New Store, 2016)
21 fields, on average, have to be completed for a mobile purchase. (New Store, 2016)
14% of surveyed brands in the US offer a mobile POS. (New Store, 2016)
22% of brands surveyed in the US provide buy online, pick up in store through their app. (New Store, 2016)

