Retail Trends Factfile: E-commerce

53% of European sales will be affected by a digital channel. (Forrester, 2015)
21% of European online adults regularly research products online, even though 26% do not regularly buy online. (Forrester, 2015)
Online checkouts are still too complicated. As many consumers abandon their shopping because the checkout is too complicated as want to ponder on it longer. Almost a 1/3 of consumers in both cases. (Tangent Snowball, 2015)
28.7% of respondents said navigation is the biggest frustration when shopping online. (Tangent Snowball, 2015)
On average consumers search for 12 minutes online before making a purchase. (Tangent Snowball, 2015)
Consumers want a personalised experience but not to be called by their first name. Just under half of respondents didn’t want to be addressed on a first name basis. (Tangent Snowball, 2015)
Almost half of women (48.3%) spend longer than 16 minutes when searching for tech products, compared to 41.5% of men. (Tangent Snowball, 2015)
90% of shoppers who use an e-commerce site say that delivery is the biggest annoyance. (MyCustomer, 2014)
We all know the statistic that 67% of people who go through to a site don’t convert, but when surveyed we found that two-thirds of those cite delivery time as a reason for abandoning their cart (MyCustomer, 2014)
Men are more likely to abandon their shopping basket because the checkout page is “too complicated” – 30.6% of men : 25.1% of women. (Tangent Snowball, 2015)
Twice as many men think loyalty programmes are more important online – 10.3% of men thought loyalty programmes online were more important than offline compared to 4.2% of women (Tangent Snowball, 2015)
Men are more likely to shop on mobile and PC – 10.3% of men shop primarily on mobile : 7.2% of women, and 31% on PC : 23.3% of women (Tangent Snowball, 2015)
Women are more likely to shop on a laptop – just over half of the women surveyed (53.1%) listed laptop as their primary shopping medium (Tangent Snowball, 2015)
Women are more impatient – 21.1% of women reported being most frustrated by page loading times, compared to just 15.5% of men (Tangent Snowball, 2015)
Men dislike complicated – 33.4% of men listed websites that were difficult to navigate as their biggest frustration, compared to just 24.6% of women (Tangent Snowball, 2015)
Increasing customer retention rates by just 5% increases profits by 25% to 95%. (Bain & Co).
Globally, the average value of a lost customer is $243.(KISSmetrics)
The change in number of shoppers visiting a site contributes 84% of the growth in digital commerce. (DemandWare, 2015)
Average time per online visit is 9.4 minutes, a decrease of 3% from 2014. (DemandWare, 2015)
55% of shoppers said they will use a retailer’s app for or while shopping and 34% claimed to use a third-party app for the same. (Cisco, 2015)
U.S. consumers want a more personalised retail experience but are divided on retailers’ tactics and the types of personal information they feel comfortable disclosing, according to a new survey from Accenture. Nearly 60% of consumers want real-time promotions and offers, yet only 20% want retailers to know their current location and only 14% want to share their browsing history. (Accenture, 2015)
The most welcome in-store retailer communications and offerings include automatic discounts at checkout for loyalty points or coupons (82%) and real-time promotions (57%). When it comes to personalized online experiences, the most popular choices were website optimized by device (desktop, tablet, mobile) (64%) and promotional offers for items the customer is strongly considering (59%). (Accenture, 2015)
The research found that while many consumers are willing to share some personal details with retailers, nearly all (90%) of the respondents said if the option was available they would limit access to certain types of personal data and would stop retailers from selling their information to third parties. In addition, 88% would prefer to determine how the data can be used and 84% want to review and correct information. (Accenture, 2015)
Consumers are more willing to share certain personal details with retailers, including demographic information such as gender (65%), age (53%) and contact information (52%), although a significantly smaller percentage (24%) would share their contact information on social media. Financial (credit score), medical and social media contacts details are deemed the most sensitive, with 13, eight and five %, respectively, willing to share this information with retailers. (Accenture, 2015)
Baby Boomers are more demanding than Millennials when it comes to receiving benefits in exchange for their data. Almost three-quarters (74%) expect to get automatic crediting for coupons and loyalty points, and 70% expect special offers for items they are interested in, versus 58% and 61% of Millennials, respectively. (Accenture, 2015)
The product of shopper frequency, conversion rate and average order value, contributes 16% of the growth in digital commerce. (DemandWare, 2015)
Computer order share is highest between 9am and 10am. (DemandWare, 2015)
Branded websites are the second-most-trusted advertising format (70%), behind recommendations from friends and family (83%). (Nielsen, 2015)
Two-thirds trust consumer opinions posted online — the third-most trusted format. (Nielsen, 2015)
The proliferation of online ad formats has not eroded trust in traditional paid advertising channels. Roughly six-in-10 say they trust ads on TV (63%), in newspapers (60%) and in magazines (58%). (Nielsen, 2015)
Millennials show the highest levels of trust in 18 of 19 advertising formats/channels, including TV, newspapers and magazines. (Nielsen, 2015)
Trust in paid online and mobile ads has stayed relatively consistent since 2013. Almost half of global respondents say they completely or somewhat trust online video ads (48%, no change from 2013), ads served in search engine results (47%, down one percentage point) and ads on social networks (46%, down two percentage points). About four in-10 global respondents trust online banner ads (42%, no change) and mobile advertising (43%, down two percentage points). Just over one third say they trust mobile text ads (36%, down one percentage point). (Nielsen, 2015)
Self-reported action exceeds trust by more than double digits for ads served in search engine results (47% trust; 58% take action), ads on social networks (46% trust; 56% take action) and text ads on mobile phones (36% trust; 46% take action). (Nielsen, 2015)
Millennials (age 21-34), who came of age with the Internet, have the highest levels of trust in online and mobile formats, followed closely by Generation X (age 35-49). (Nielsen, 2015)
33% of shoppers said they would head to a competitor that offers a more convenient or streamlined shopping experience. (FierceRetail, 2015)
More than 50% of shoppers consider the ease of returning to be “very important” when deciding from which retailer to buy. (FierceRetail, 2015)
44% of UK tablet owners price check and research on tablet devices. (RetailWeek, 2015)
32% of UK consumers, 27% Germany, 21% Netherlands shop mostly online. (RetailWeek, 2015)
When making a purchasing decision, the most important factors are cost (75.5%), free delivery (60.4%), free returns (32.2%), customer service (29.9%), peer reviews (22.8%), brand (22.7%) and click and collect service available (11.7%). (RetailWeek, 2015)
When making an online payment in the UK, 84.7% said the most important thing was security, 6.9% said it was convenience, 4.1% said it was speed, 2.9% said reliability and 1.5% said availability of different payment methods. (RetailWeek, 2015)
When paying online, 76.9% use Paypal, 65.3% use credit or debit card, 3.8% use Apple Pay, 2.6% use Pingit, 2% use digital wallet, 1.3% use bitcoin. (RetailWeek, 2015)
Causes for aborting an online purchase within the last six months include security concerns (30%), too much information needed (23.7%), slow payment process (21.8%), too many verification steps (19.1%), website too difficult to use (17.9%), couldn’t remember password details (13.3%), privacy concerns (13.1%), not enough payment options (11.5%), terms and conditions (8.4%). 38.1% hadn’t aborted a purchase. (RetailWeek, 2015)
When making a purchase, 26.4% said they were happy sharing personal data, 21.3% said no, and 52.3% said it depended on the company’s privacy policy. (RetailWeek, 2015)
In exchange for sharing personal data, customers in the UK expected to receive personalised offers based on search and purchase history (52.3%), personalised pricing based on search and purchase history (39.2%), staff to make product recommendations based on online history (27.4%), personalised marketing emails (26.6%), personalised adverts when shopping online (20.2%), staff to greet you by name when shopping in store (12.3%). 7.2% don’t share data and 6.4% actively stop retailers using data to send personalised offers. (RetailWeek, 2015)
In the UK, 64.8% happy to have online shopping behaviours used to create an individual profile about shopping habits. (RetailWeek, 2015)
48% of UK consumers have made a purchase from a non UK website. (RetailWeek, 2015)
On average, online consumers spend some 225 minutes per week shopping online. Across the course of a year, this adds to around 8 days spend shopping online. The average consumer visits around 16 retail websites per week, even if just to browse (Webloyalty, 2015)
It was found in 2014 that e-Retail now accounts for an estimated 24% of the total retail market (CapGemini, 2014)
In 2014, there was 14% growth for the online retail market in 2014 (CapGemini, 2014)
74% of online shoppers discover new products through reviews and recommendations on websites and social media (Webloyalty, 2015)
56% of consumers say that if a retailer gave them a good personalised experience they would make an effort to use their site more (Webloyalty, 2015)
Some 15% of us shop at home while in bed, and a smaller 2.7% shop while commuting to and from work (Webloyalty 2015)
35% of online shoppers base purchasing decisions on recommendations and customer reviews on websites and social media (Webloyalty, 2015)
28% of UK respondents researched their last purchase only online – the highest rate in Europe (Google Consumer Barometer, 2014)
Options such as “click and collect” have contributed to the UK e-commerce growth, which rose by +15.4% in April and represents more than 30% of the European e-commerce market (BRC-KPMG Online Retail Sales Monitor, 2015)

British consumers are more likely to buy travel services online than any other product or service category. 84% of respondents said they buy leisure flights online, and 79% buy hotel accommodation online. Grocery brands rely the least on digital – 16% of UK consumers order groceries online (Google Consumer Barometer, 2014)
The value of Internet sales decreased by 0.2% in January 2015 compared with December 2014 and accounted for 11.6% of all retail sales in January 2015. Online sales increased by 12.0% compared with January 2014 (National Statistics, 2015)
In 2014, £104 billion was spent online over the Christmas period which is a 13% growth on 2013 (CapGemini, 2014)
£810m was spent online on Black Friday 2014, the biggest ever day for UK online sales (Experian & IMRG, 2015)
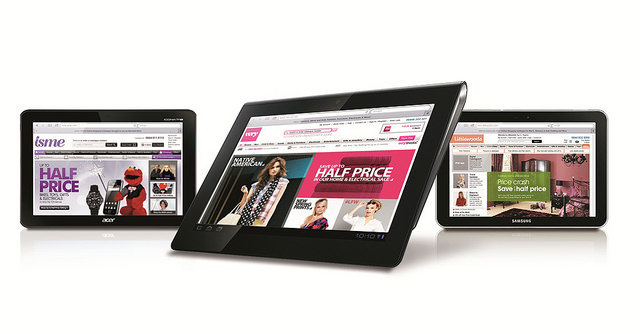
In the UK, 74% of tablet owners use the devices regularly to browse or buy products. Tablets are the most heavily used device, with those shopping via them spending an average of 72 minutes per day on the devices (Webloyalty, 2015)
37% of tablet shoppers agree that they are great for browsing and shopping (Webloyalty 2015)
In 2015, tablet searches have increased by 11% in the first quarter of the year (British Retail Consortium, 2015)
When it comes to actually buying products, visiting online shops via a desktop PC or laptop is used by some 87% of consumers surveyed, compared to 78% visiting physical shops (Webloyalty, 2015)
27% of consumers surveyed state that they almost always used a desktop PC for internet shopping purposes, rising to some 32% for laptop users (Webloyalty 2015)
Globally, E-commerce accounts for approx 6% of total retail sales (NRF, 2015)
In 2014, around 2.2 billion people owned a connected device, such as a PC, laptop, smartphone or tablet. By 2020, more than 4 billion people are expected to own a connected device (Creative Strategies, 2014)
Cross device usage is now the norm for 41% of shoppers worldwide. In 40% of purchases, consumers use multiple devices to visit the same retailer prior to purchase (Internet Retailing, 2015)
China’s online retail spending reached $307 billion in 2013 and is forecast to grow at a compound annual rate of nearly 20% until 2019, when it should exceed $1 trillion (Evigo.com, 2015)
By year-end, mobile share of eCommerce transactions is forecast to reach 33% in the US and 40% globally (Internet Retailing June 2015)
Of a survey of 150,000 people in 50 countries, one in three respondents made their last clothing or footwear purchase online. That compares to 49% of people in the UK doing so, and 75% of people in South Korea. (Google Consumer Barometer, 2014)
53% of British over 55s have access to a computer. Norway and the Netherlands lead the way for senior internet access, with 87% and 86% of the senior population (respectively) having access to a desktop or laptop computer. Malaysia was the least connected nation for over 55s, with just 17% having access to a computer and just 61% to a mobile phone (Google Consumer Barometer, 2014)


